Turn your operational data into information for better decisions.
VoyaMetrics Analytics lets you track indicators, analyse results and gain a structured view of business performance — by product, customer, supplier, branch and employee.
From scattered data to management insight
Without Analytics
- Sales, BSP and supplier data spread across different systems and spreadsheets
- Reports assembled by hand at the end of each month
- Difficulty comparing periods and spotting trends
- Little visibility over margin by customer, supplier or employee
With VoyaMetrics Analytics
- Consolidated indicators by area: files, air, suppliers, customers and teams
- Filters by base year, comparison period, mode and branch
- Year-on-year comparison on every indicator
- Pivot tables and reports exportable to Excel and PDF
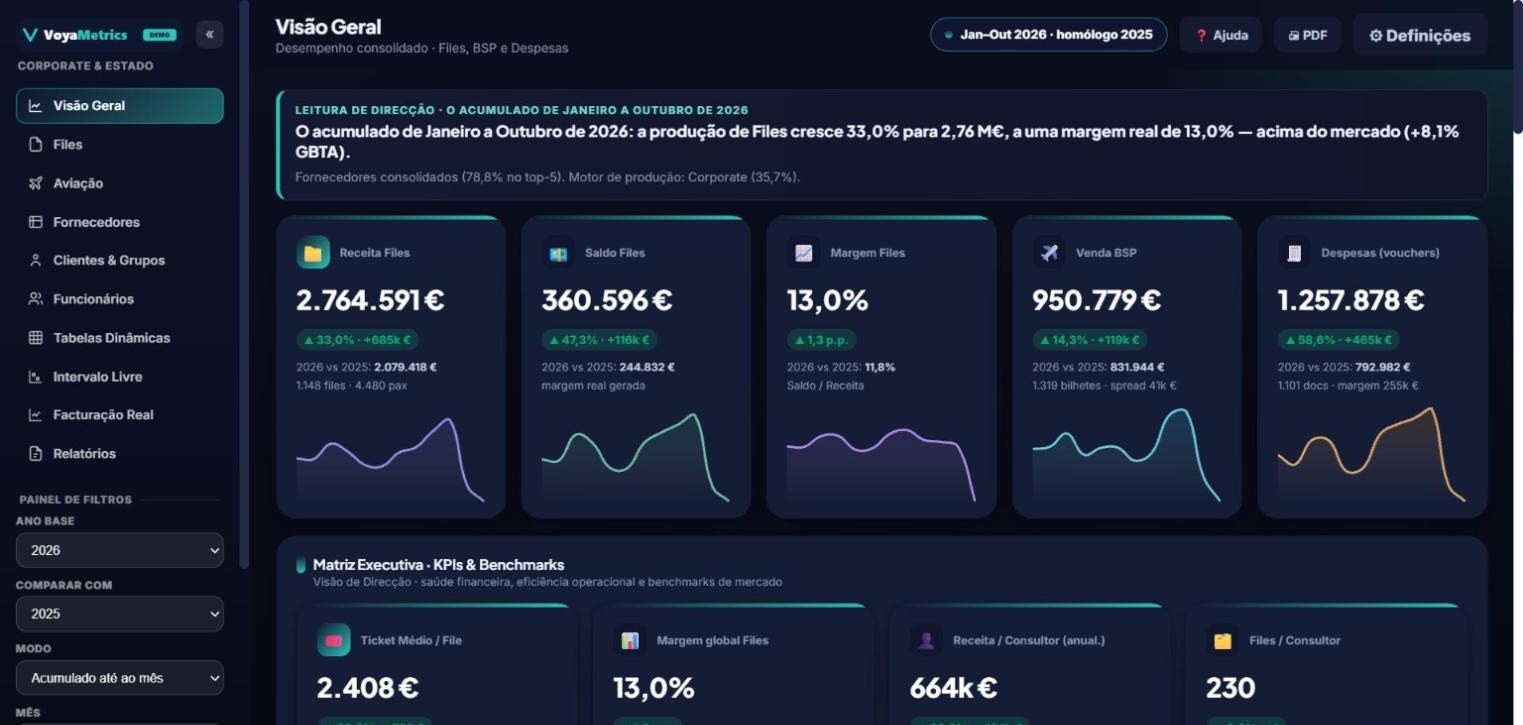
A performance overview on a single page
Revenue, balance, margin, BSP sales and expenses, with variance against the comparison period and trends across the year.
- 01Management summaryA plain-language reading of the period at the top of each area.
- 02Executive matrixFinancial health and operational efficiency KPIs, including market benchmarks.
- 03Filter panelBase year, comparison, year-to-date or monthly mode, month and branch.
Air, suppliers, customers and teams
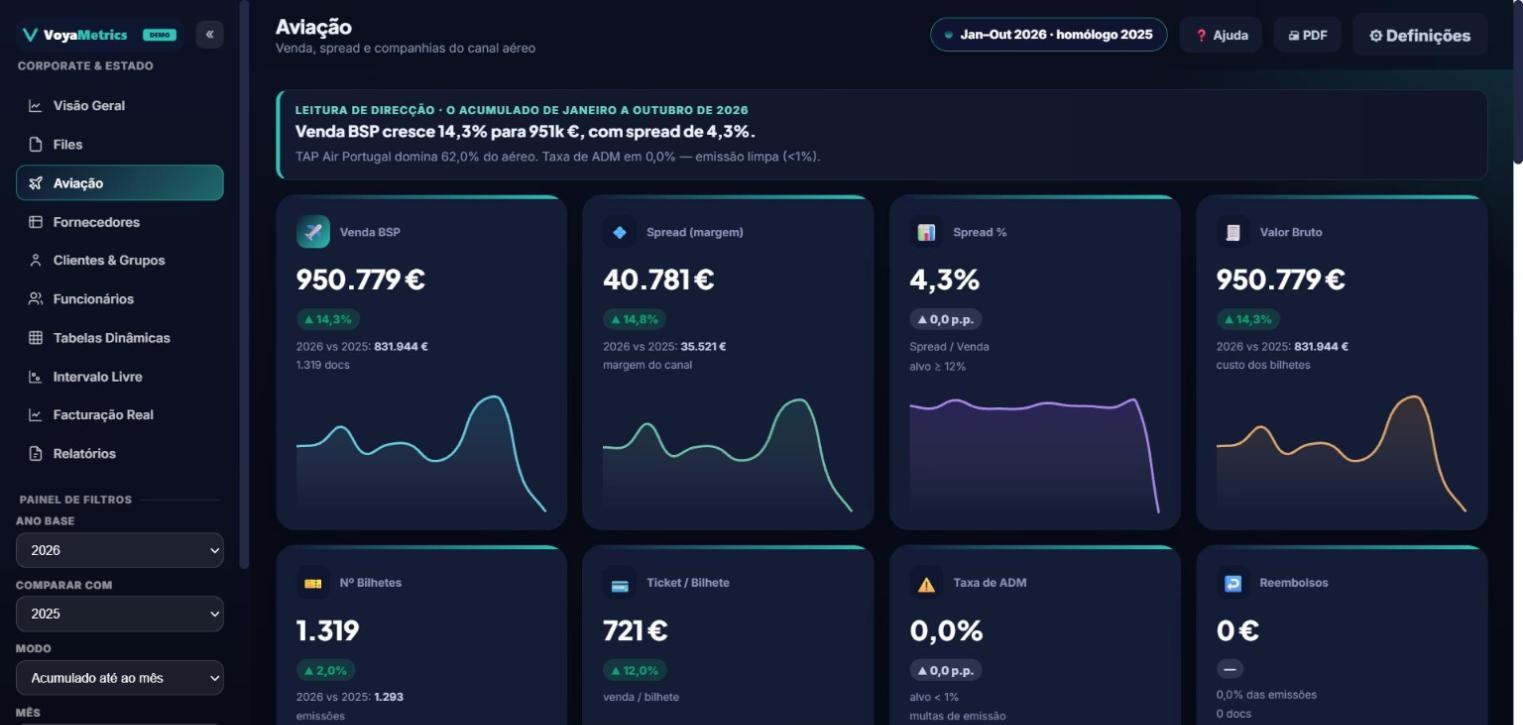
Each business area has its own analysis: BSP sales and spread, supplier vouchers and margin, customers and groups, performance by employee.
- 01Air (BSP)Sales, spread, tickets issued, average ticket, ADM rate and refunds.
- 02SuppliersVoucher sales, cost, margin, bed banks and purchase concentration.
- 03Pivot tablesFree cross-analysis of universes and dimensions, with Excel export.
Management and decision reports
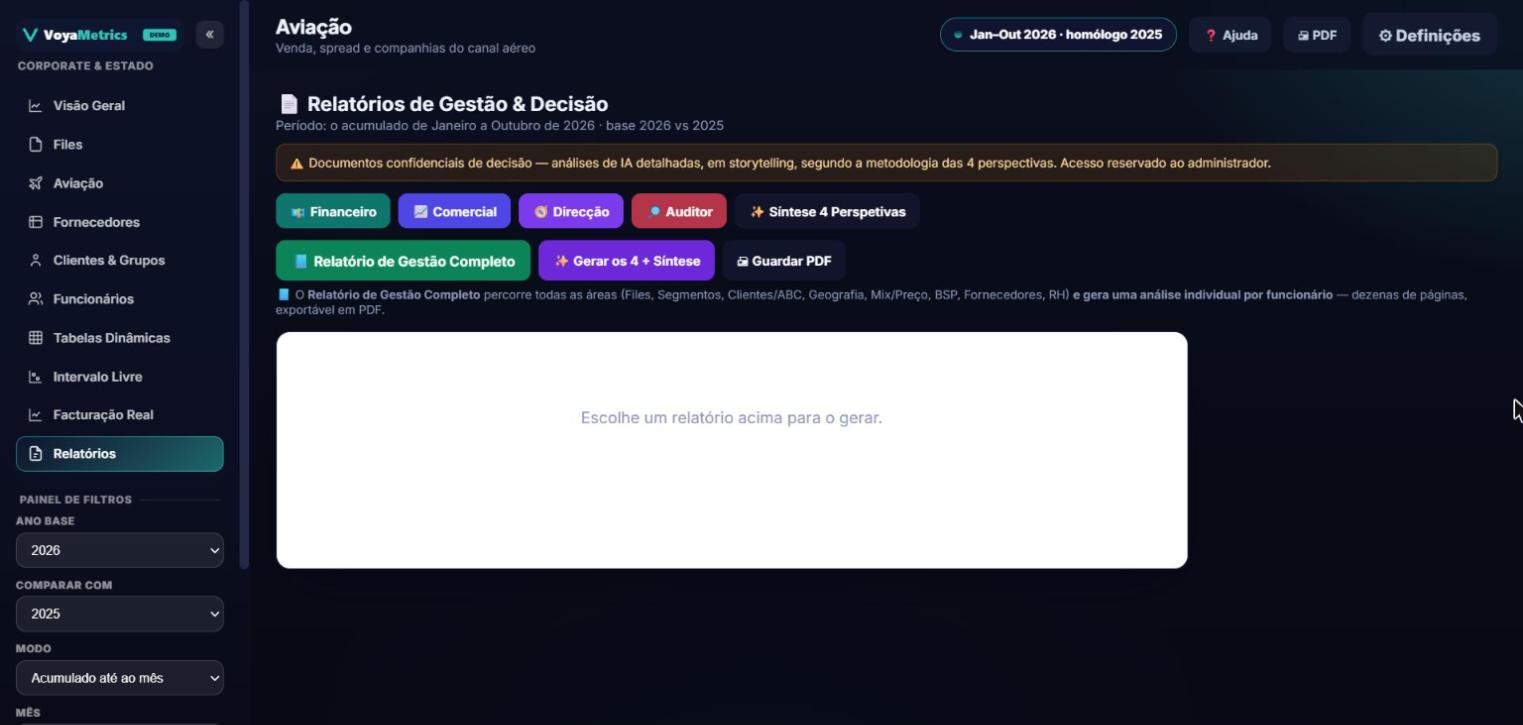
Reports by perspective — financial, commercial, management and audit — plus a complete management report, exportable to PDF.
- 01Four perspectivesFinancial, commercial, management and auditor analyses, with an integrated summary.
- 02Complete management reportCovers every business area and includes an individual analysis per employee.
- 03ExportPDF for board meetings; Excel for detailed analysis.
Everything you need to track performance
Dashboards
Indicator cards with monthly trends and variance against the comparison period.
Performance indicators
Revenue, balance, margin, average ticket, production per consultant and other management KPIs.
Analysis filters
Base year, comparison period, year-to-date or monthly mode, month and branch.
Period comparison
Year-on-year and custom date ranges for specific analyses.
Pivot tables
Analysis by customer, supplier or other dimension, with sorting and variances.
Reports
Management and decision reports by perspective, exportable to PDF.
Data import
Import data files to complement the information from connected sources.
Export
Export to Excel and PDF for sharing and detailed analysis.
Customers, groups and employees
Performance by customer, corporate group and consultant.
More visibility, more confident decisions
- Greater visibility over company performance
- Tracking of the indicators that matter to management
- Structured analysis of operational information
- Comparison of results and identification of trends
- Support for decision-making
How it is used
Monthly board meeting
Year-to-date overview against last year and a management report in PDF.
Supplier negotiations
Purchase concentration, volume and margin by supplier to prepare negotiations.
Team management
Production and margin by consultant and branch to track targets.
Available on its own or as part of the complete suite
VoyaMetrics Analytics can be purchased separately. Combined with CRM and SLA, it completes the management view across sales and service.
See the applications at work in the context of your business.
Book a demo of the complete suite or of a single application. There is no obligation to buy all three.